
I’m Emily, a data viz enthusiast and practitioner.
I’m passionate about the intersection of data and social sciences, making cool interactive visualizations, and using data as a tool to illuminate new perspectives.
Selected Works
Presentation Design at Opportunity Insights
Establishing style guidelines and designing compelling slide decks for high-profile academics.
Information Design
PowerPoint
Formative Films, Fallible Representation
Using the box office data and the Bechdel Test to examine representation of women in films.
Data Viz
d3.js
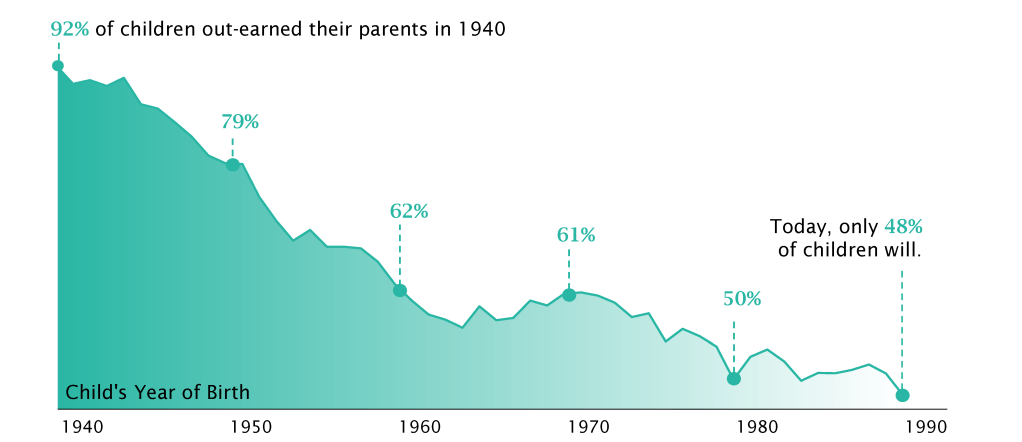
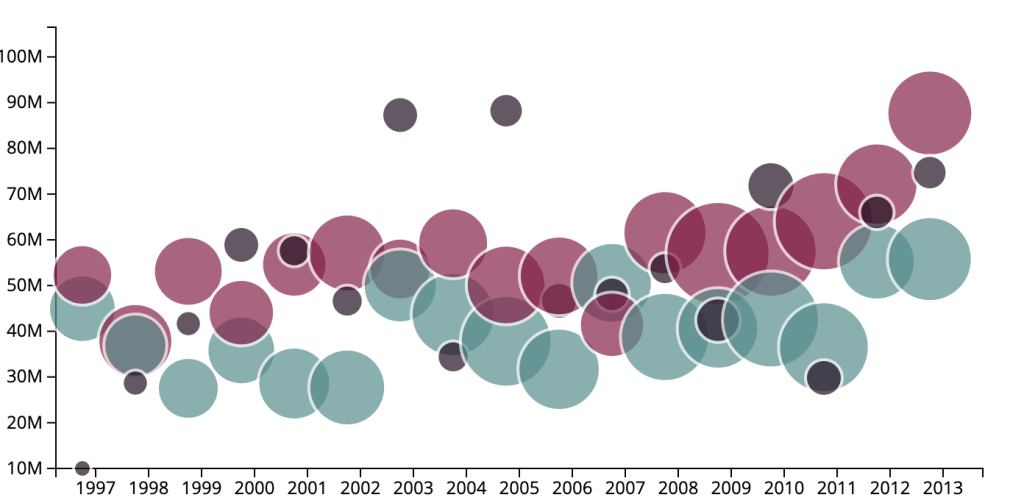
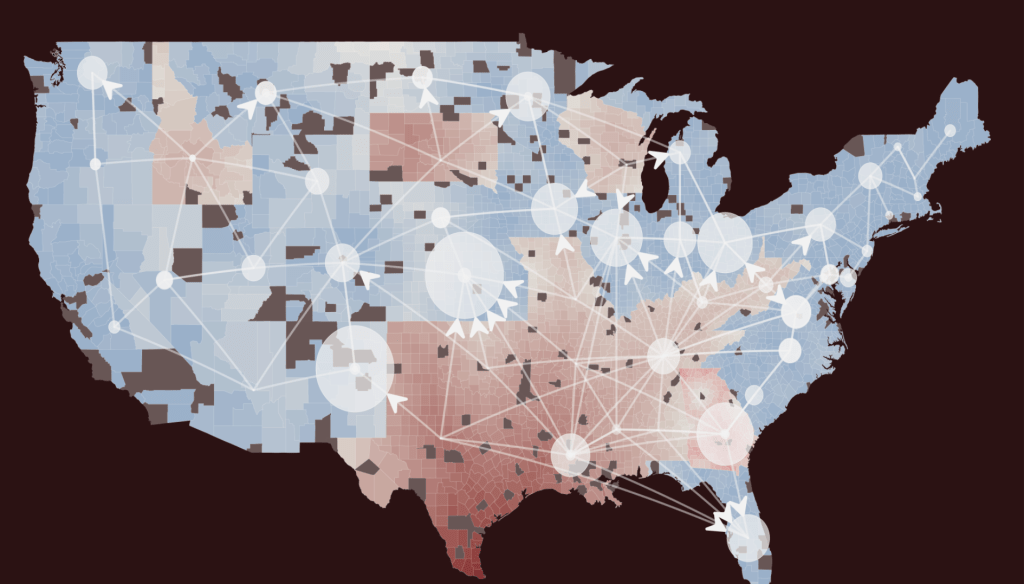
The State of Abortion Access in Post-Roe America
A series visualizing the 2022 Roe v. Wade decision and its impact on the county, state, and national scale.
Data Viz
d3.js
Illustrator
p5.js
ggplot2
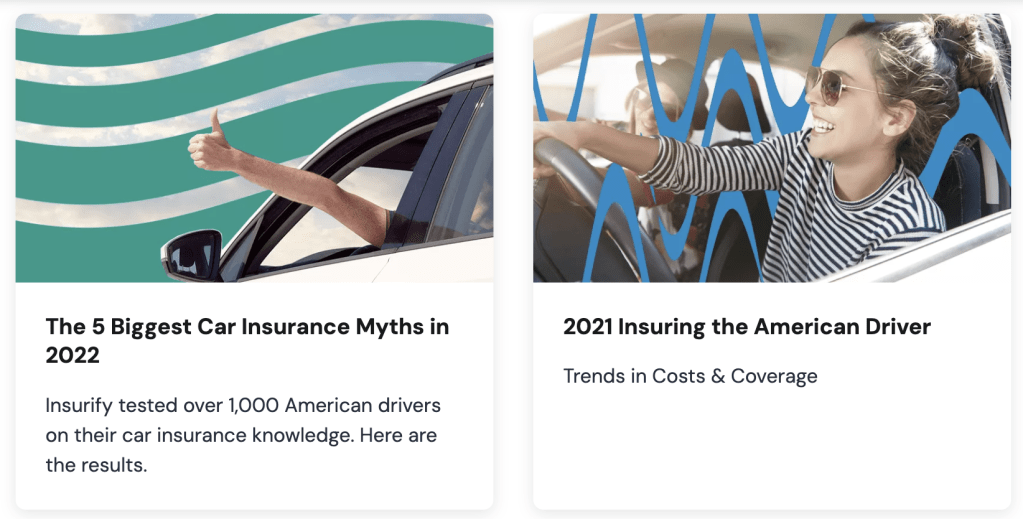
Insurify Annual Reports
As the Data & Research Content Lead at Insurify, I coordinated the research, analysis, design, and press strategy for Insurify’s annual and specialized reports.
Information Design
SEO
Media Strategy
R
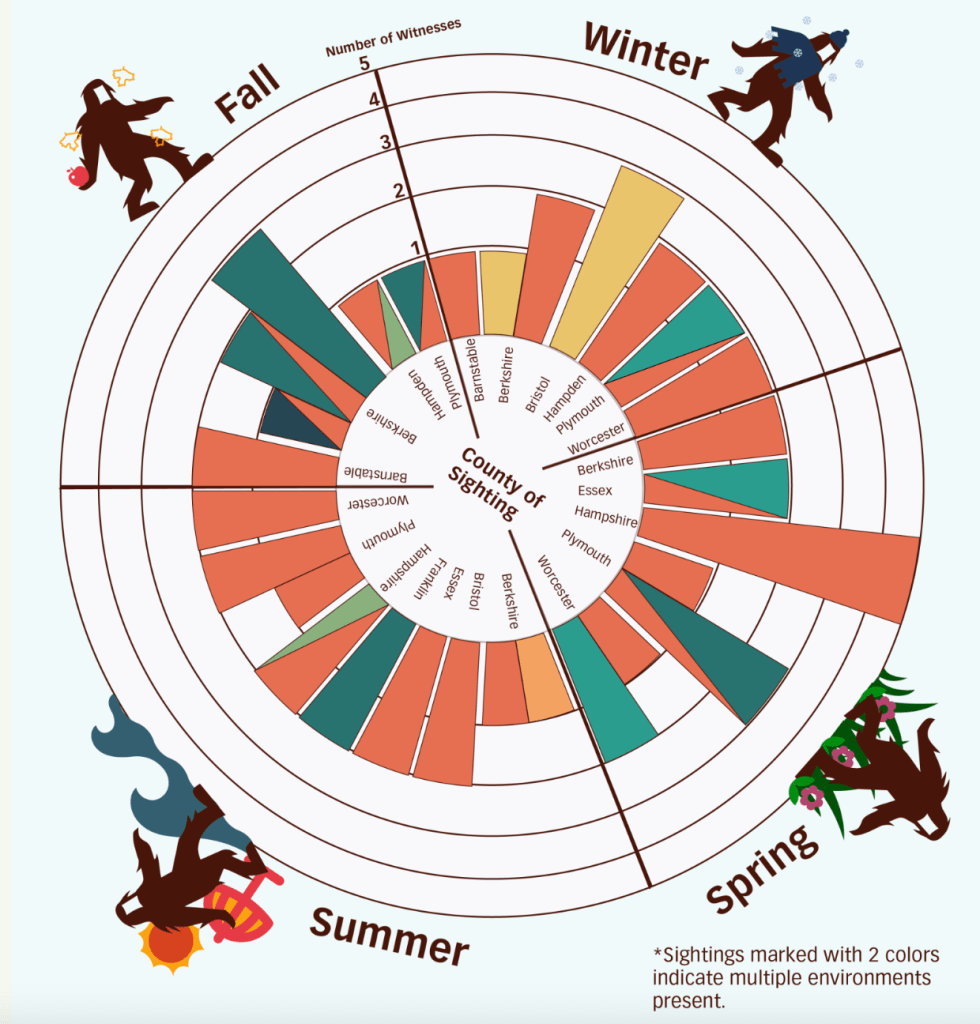
Bigfoot lives in Massachusetts (!?)
Visually diagramming Massachusetts Bigfoot sightings from the past 30 years.
Data Viz
d3.js
Illustrator
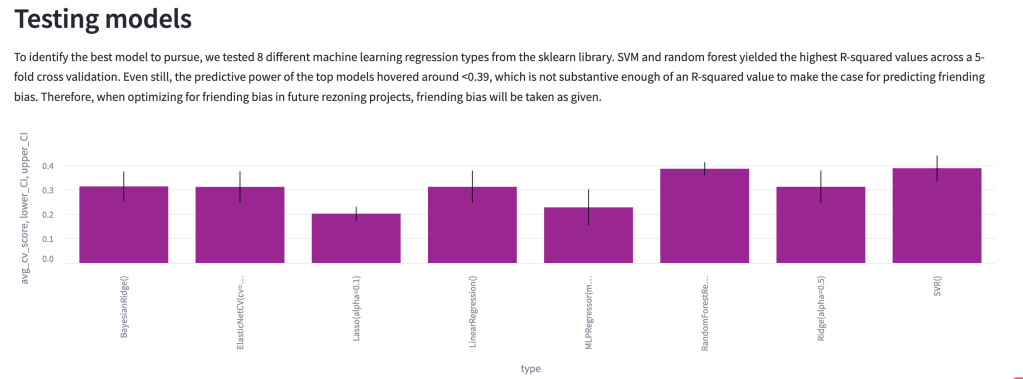
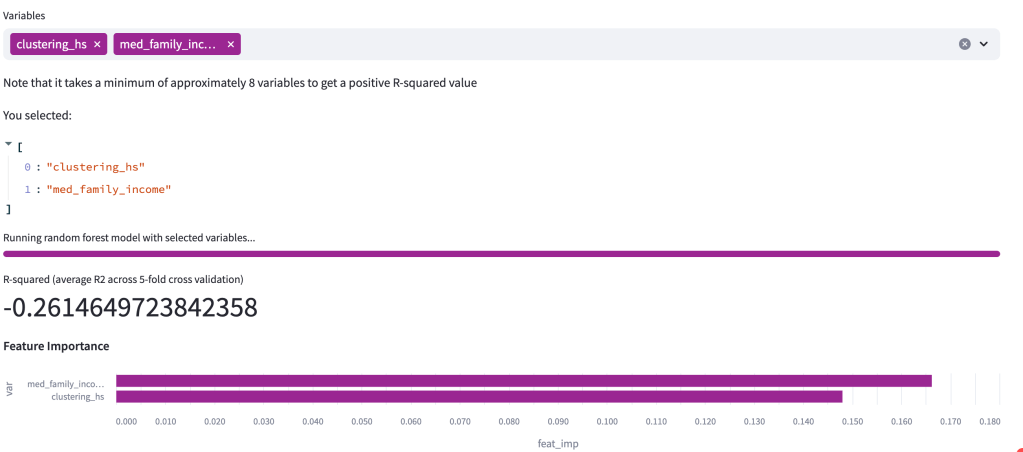
Predicting Friending Bias
Visualizing the process of testing factors to predict friending bias. This Streamlit app was made as part of my research with the Plural Connections Lab at Northeastern University.
Data Viz
Machine Learning
python
streamlit
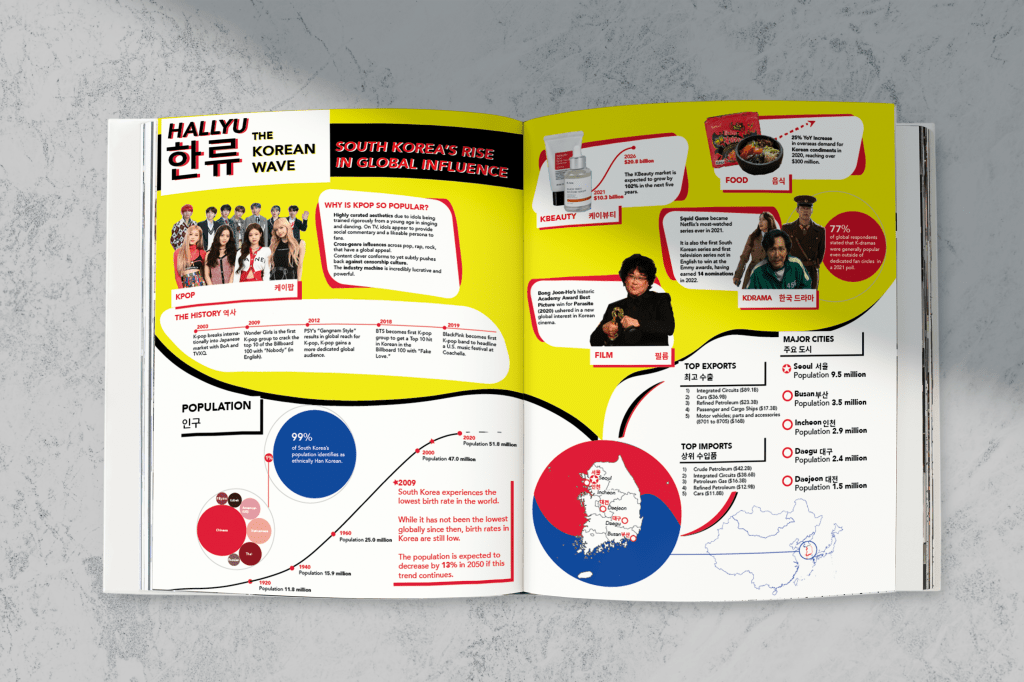
Hallyu 한류 / Korean Wave
This project explores the phenomenon of the recent “Korean Wave,” known as “Hallyu,” influenced by Korean digital aesthetics to pay homage to its global cultural influence.
Information Design
Illustrator
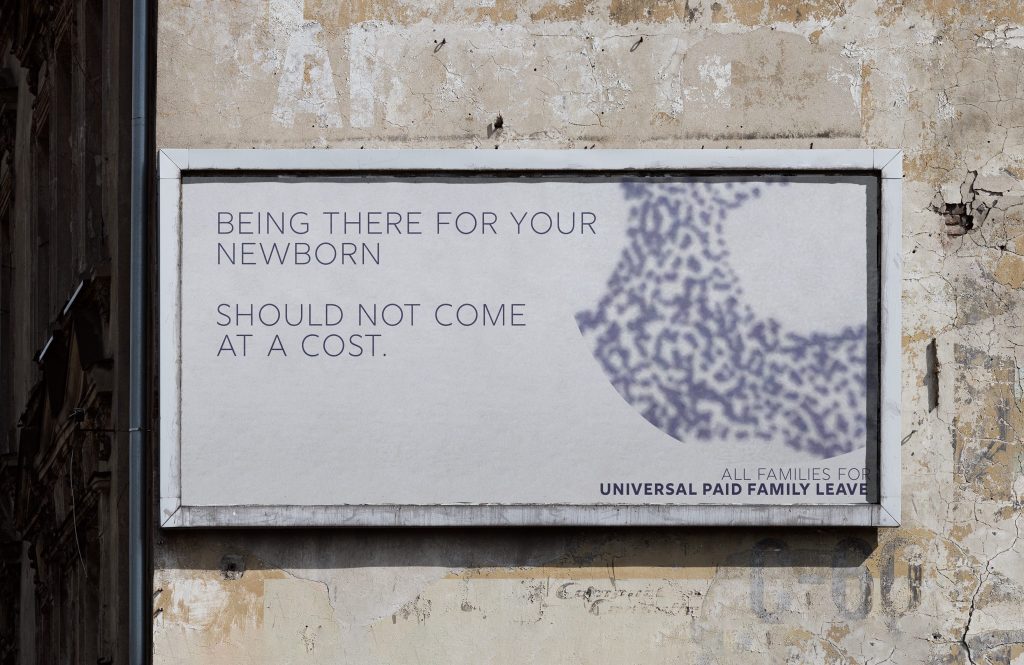
all families for
A 4-part campaign using Yoko Ono’s artistic leanings and social activism for inspiration that advocates for the urgent need for federally-mandated paid family leave in the United States.
Information Design
Illustrator
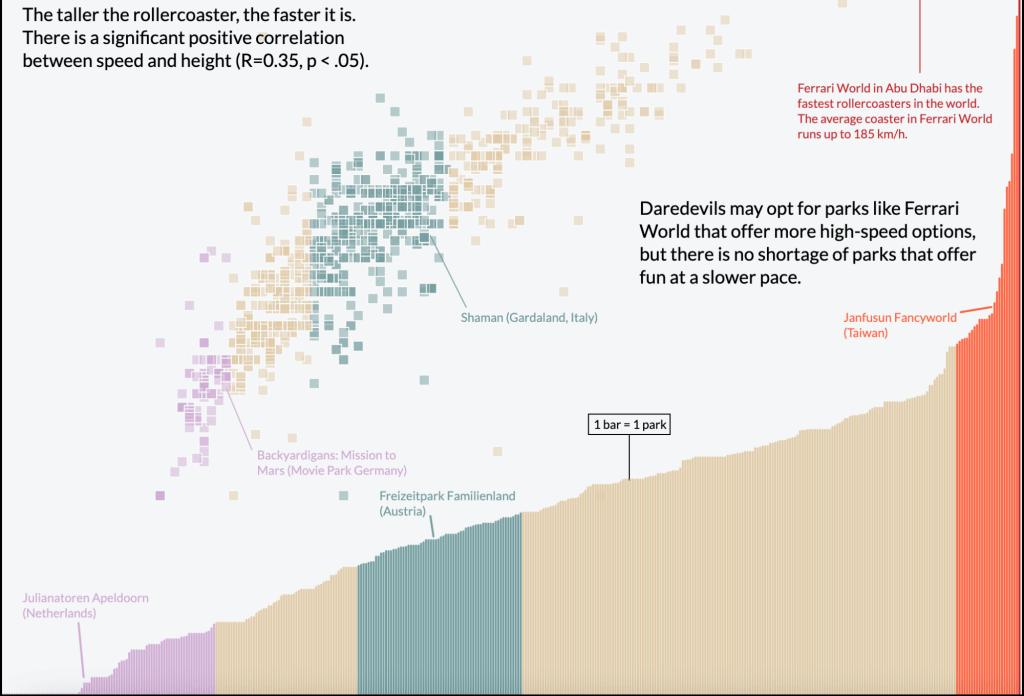
Wild Rides: The World’s Best Roller Coasters
A data-driven approach to picking your next ride.
Data Viz
p5.js
R
