The State of Abortion Access in Post-Roe America
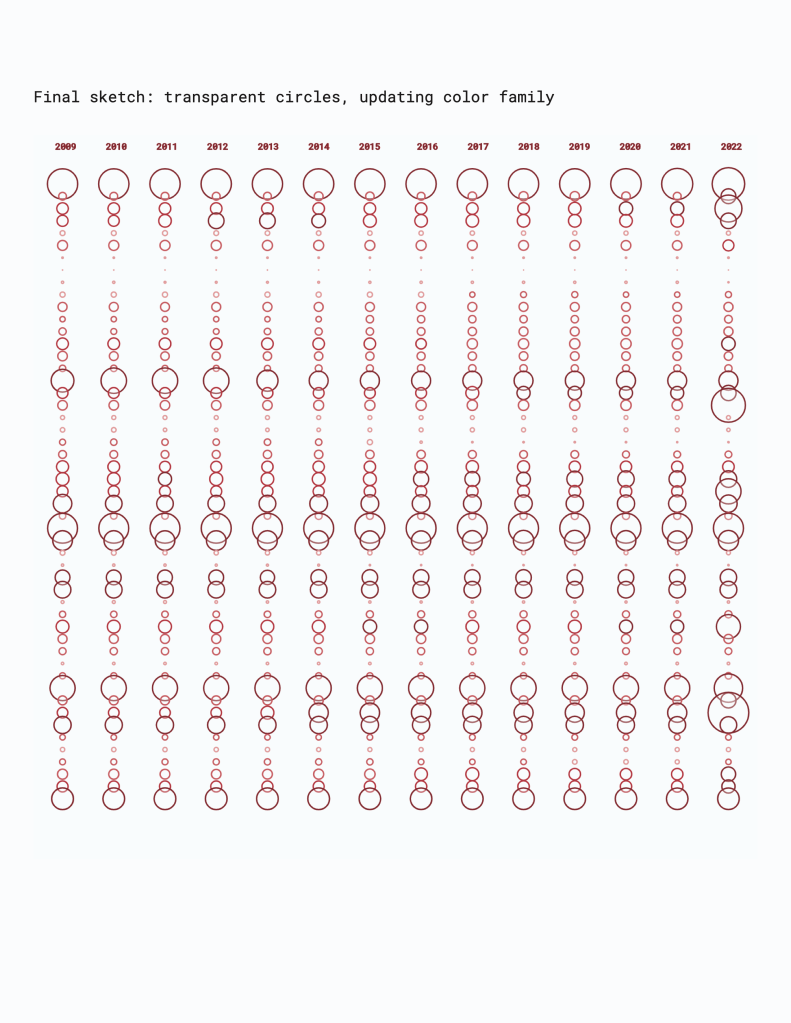
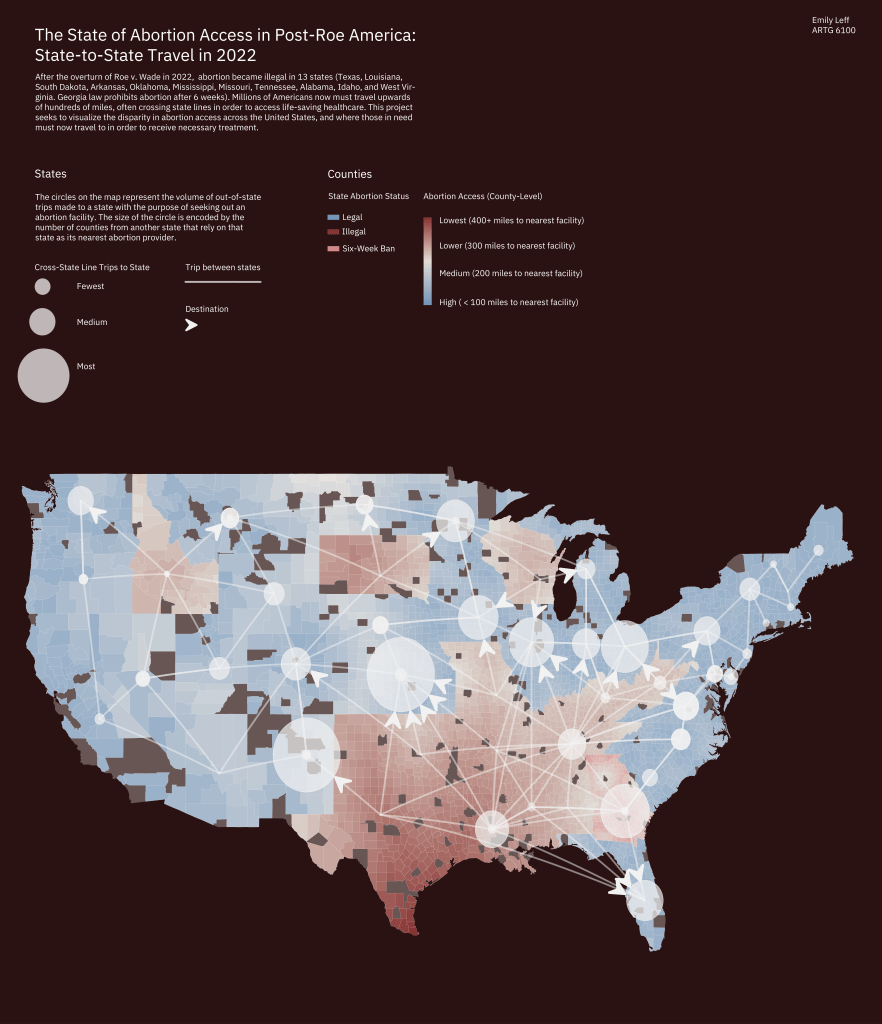
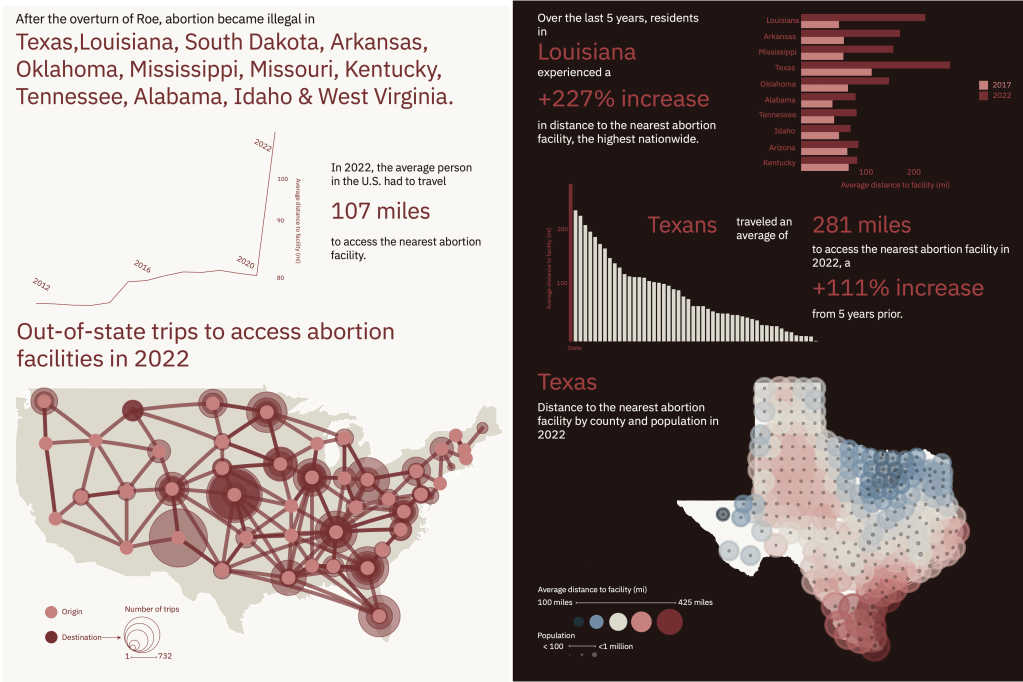
A visualization series that investigates the timely effects of Roe v. Wade’s overturn in summer 2022. I started by using p5.js to explore the dataset visually via a “data dump” or portrait to understand the shape of the dataset. From there, I created a static dashboard and single-frame static visualization using ggplot2 and Adobe Illustrator. The final installation is an interactive dashboard built using d3.js that allows users to explore abortion access by state legality status on a more granular level. My goal of this project was to identify where the overturn Roe v. Wade inflicted most immediate and extreme repercussions, in addition to understanding where and how travel between states has changed post-Roe.
The dataset used for this project comes from the Myers Abortion Facility Database (Caitlin Knowles Myers).
Interactive Visualization Dashboard
Click here to view The State of Abortion Access in Post-Roe America: Interactive Visualization Dashboard
View project code
Preview:
Single-Frame Static Visualization
Static Dashboard
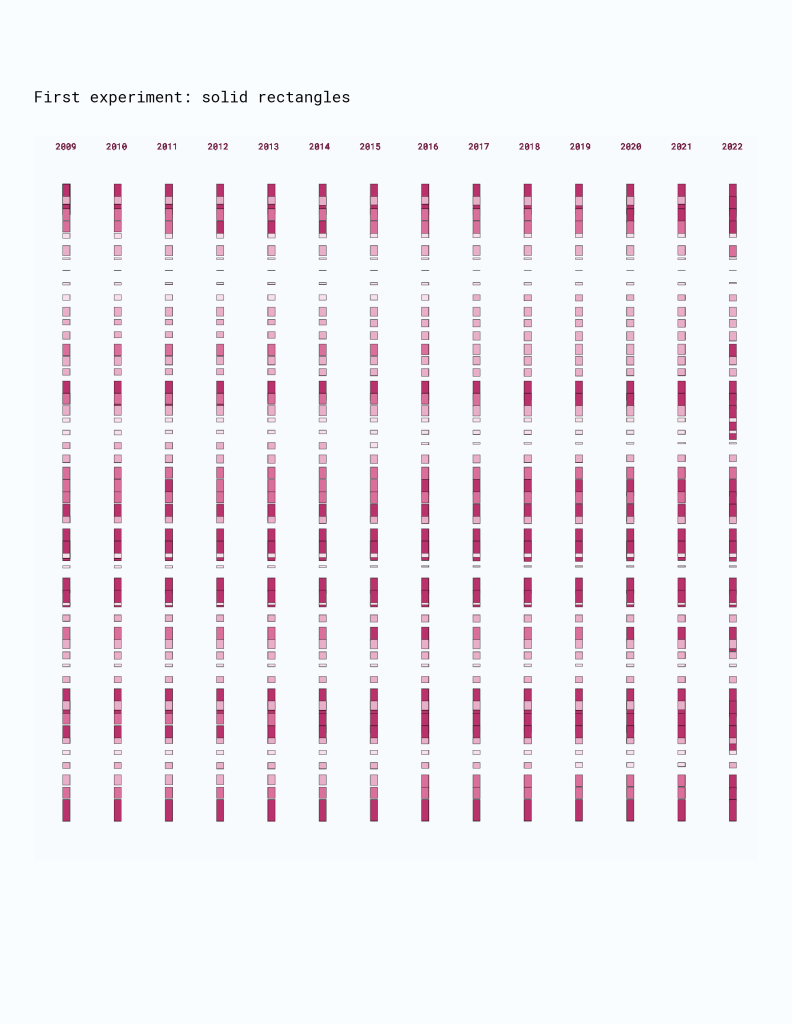
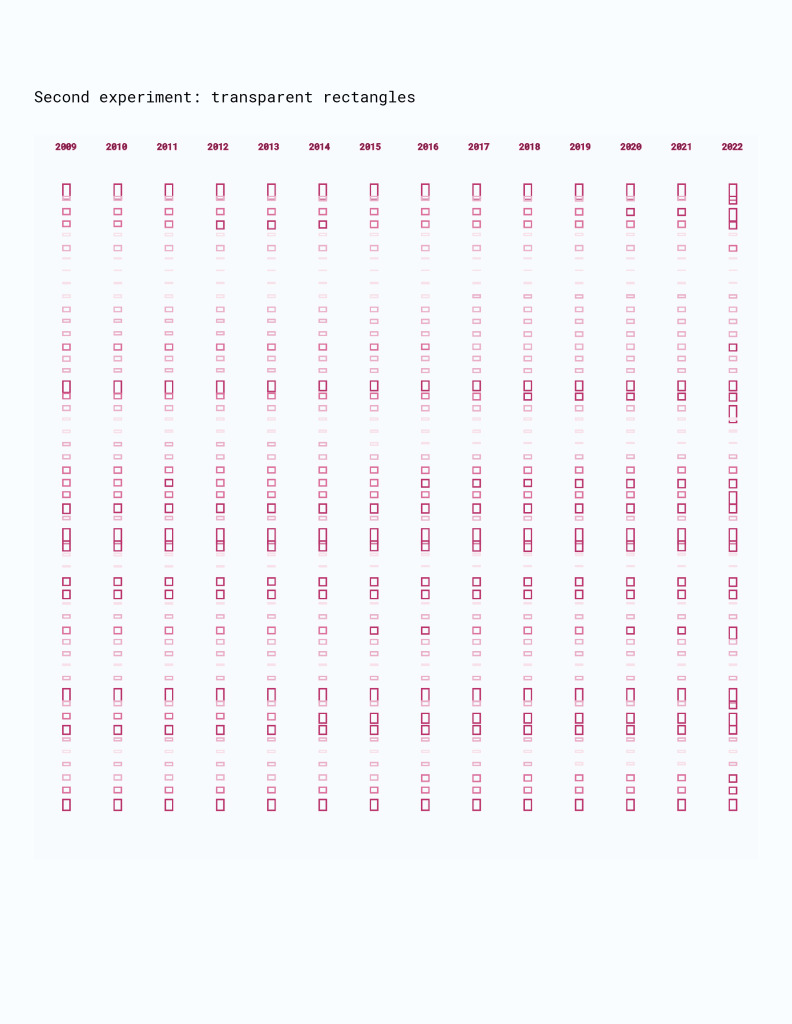
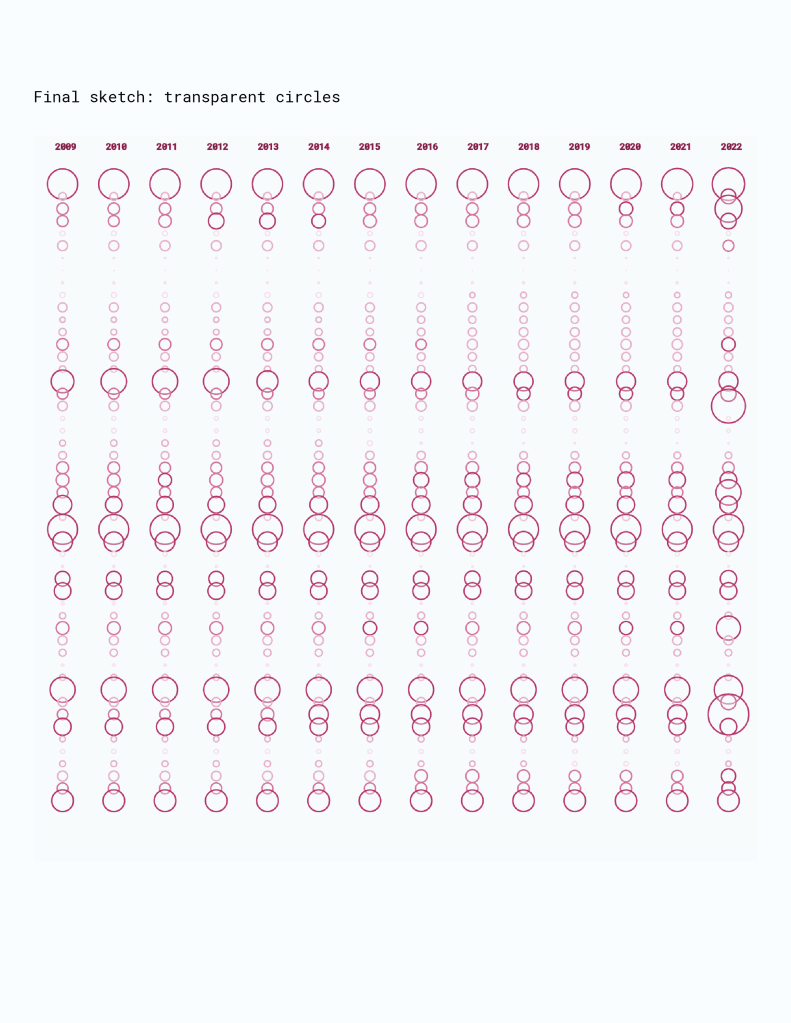
Data Portrait/Exploration