
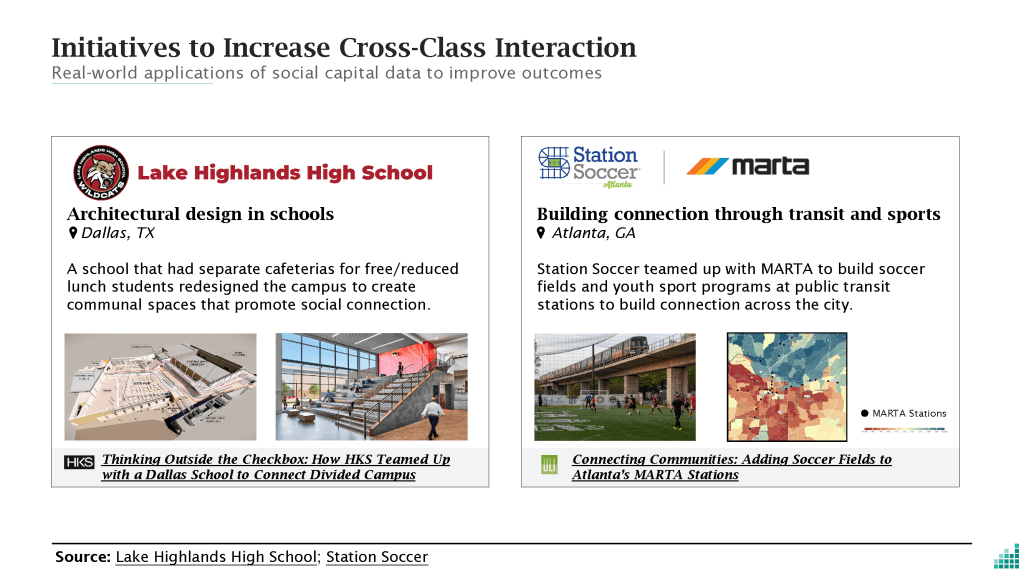
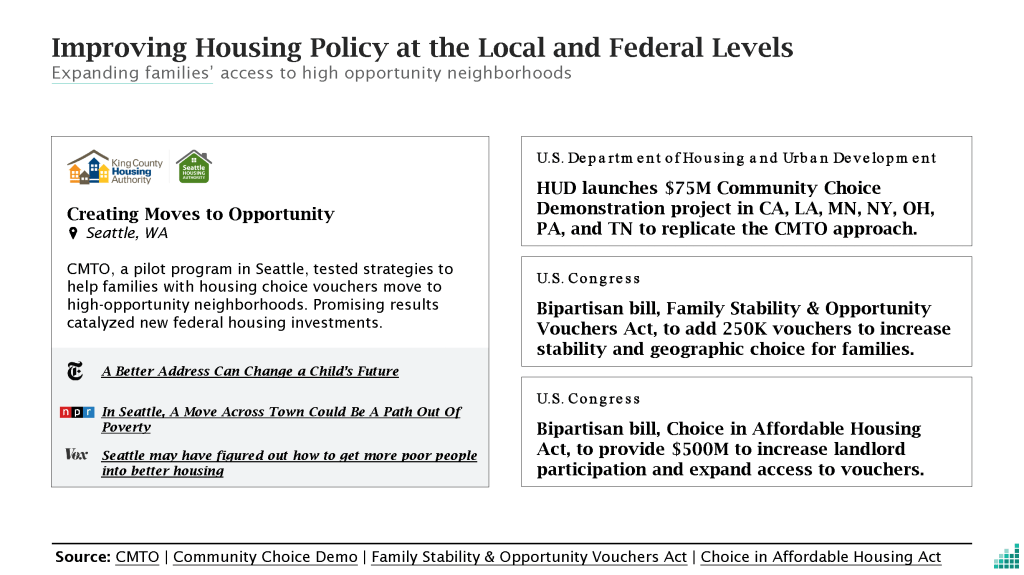
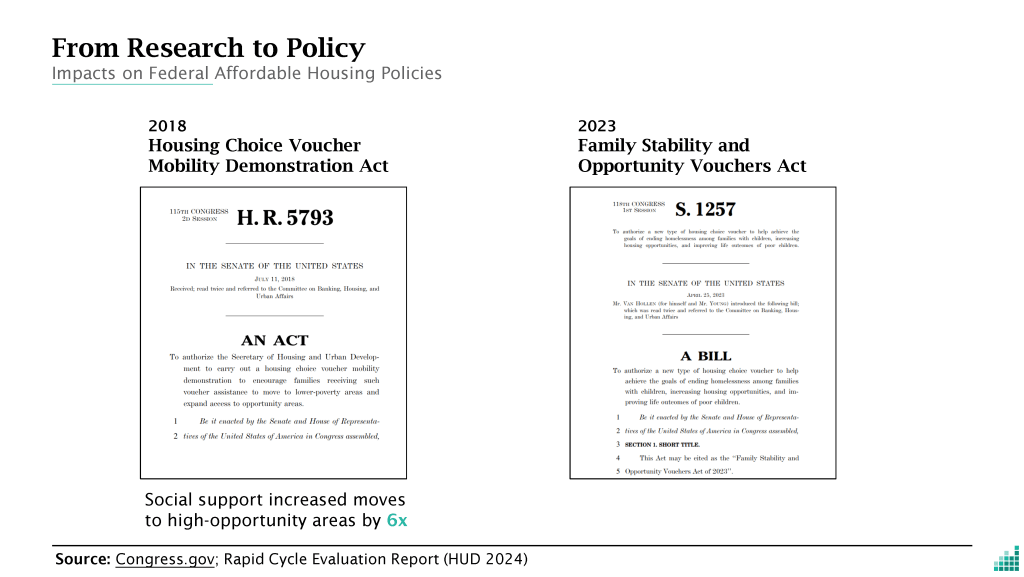
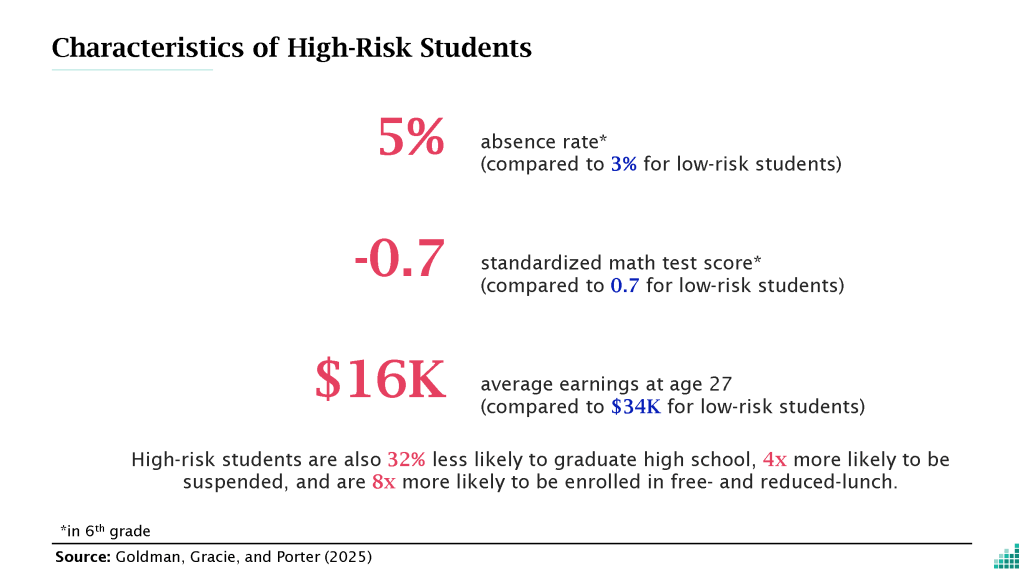
Where these slides have been presented (selected):
Raj Chetty, Science of Economic Opportunity: New Insights from Big Data, Center for Health Incentives and Behavioral Economics, University of Pennsylvania, 2025
Raj Chetty, Science of Economic Opportunity: Insights from Experimental & Observational Data, Stanford Data Science, 2025
Raj Chetty, Creating Equality of Opportunity: New Insights from Big Data, Yale University, Presidential Lecture Series 2025
About
As Research and Data Communications Associate at Opportunity Insights, I led a redesign of our organization‑wide presentation system, transforming a loosely defined brand into a cohesive, efficient, and scalable slide library.
Context
Opportunity Insights had a formal brand DNA (color palette and type families), but it wasn’t consistently applied. Slide decks for high‑profile talks and briefings were assembled from a mix of legacy and new slides, resulting in:
– Inconsistent typography, margins, icon styles, and chart treatments
– No clear guidance for new slides, so each presenter “reinvented” layouts
– Decks that felt fragmented and less polished than the quality of the research
My Approach
I audited existing decks and the brand materials, then used the established brand DNA as the foundation for a more rigorous presentation system. I:
– Defined a hierarchy of slide types (title, section opener, key insight, data‑heavy, comparison, appendix, etc.) and standardized layouts for each
– Set clear rules for typography (type choices, sizes, weights, and color usage), spacing, grid, and alignment
– Selected a unified icon family, refined chart and table styles, and standardized how we annotated key takeaways
– Designed a reusable template file and component library in PowerPoint, with built‑in footers, title treatments, and content placeholders
Results
The new system:
– Created a consistent visual voice across all presentations, reinforcing the Opportunity Insights brand in front of policymakers, funders, and media
– Reduced slide production time by giving staff ready‑made layouts and components for common content types
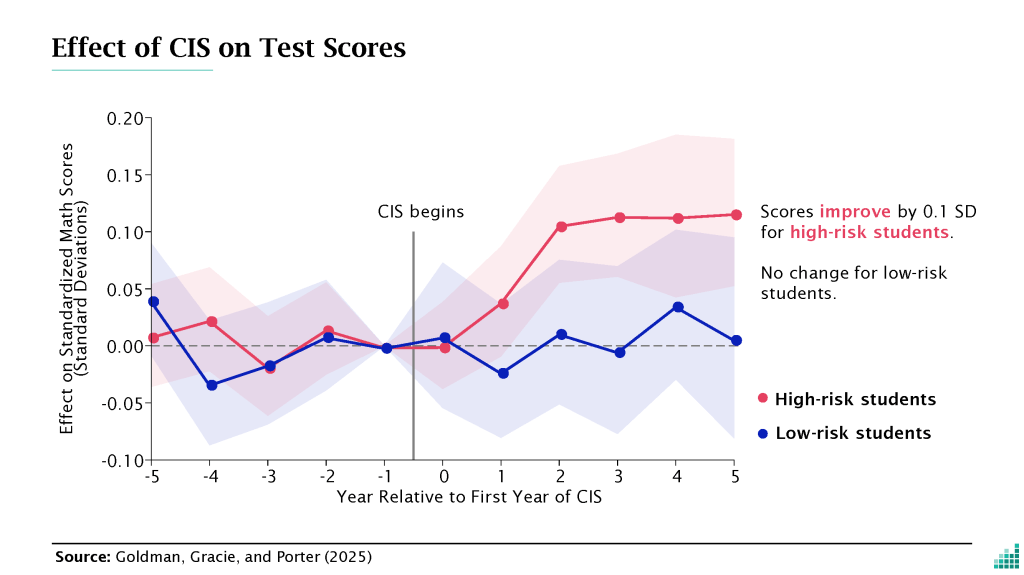
– Improved clarity and readability of data‑heavy slides, making complex findings easier to understand for non‑technical audiences
